RSI Trendlines [RG]Overview
RSI Trendlines combines the power of automatic trendline detection with the popular Relative Strength Index (RSI) indicator. This tool identifies and plots dynamic support and resistance trendlines directly on the RSI chart, helping you spot potential trend changes and divergences in momentum before they appear in price.
Key Features
Automatically detects and draws trendlines on the RSI indicator
Identifies significant pivot points in RSI momentum
Customizable appearance with adjustable colors and line widths
Built-in alerts for trendline breaks
How It Works
The indicator calculates the standard RSI using your preferred settings
It identifies pivot highs and lows in the RSI using the specified lookback period
Valid trendlines are drawn connecting consecutive pivots
Lines extend until they experience a confirmed break
Customization Options
RSI Parameters: Adjust length and source to your preference
Trendline Settings: Control pivot detection sensitivity and maximum lines
Visual Options: Customize colors, line widths, and optional midline display
Ideal For
Identifying established trends in momentum
Spotting potential RSI divergences early
Timing entries and exits based on momentum shifts
Confirming trend changes with objective trendline breaks
This indicator aims to help traders move beyond static overbought/oversold levels by revealing the dynamic structure of momentum trends and highlighting potential reversals and continuations.
Please don't use this as a buy and sell indicator. Use it to get an idea on the market trend and as an extra confirmation for your trades. Happy Trading :)
在腳本中搜尋"rsi divergence"
HTC peppermint_07 CCI w signal + s&r RSI
This CCI version enhances the traditional Commodity Channel Index (CCI) by integrating a dynamically calculated Relative Strength Index (RSI) that acts as support and resistance as shown in the screenshot, it can add as a confirmation to the divergence found in the CCI.
Key Features:
Enhanced CCI: The primary plot (black line but customizable) represents the standard CCI, providing insight into price momentum and potential overbought/oversold conditions.
Dynamic RSI Support/Resistance: The upper and lower bands (medium cyan line) are derived from a smoothed RSI, dynamically adjusting to the current market volatility. These bands serve as potential support and resistance levels for the CCI as additional confirmation for the divergence.
Overbought/Oversold Zones: The traditional overbought (+100) and oversold (-100) levels for CCI are marked with horizontal dotted lines.
Benefits:
Improved Entry/Exit Signals: Combining CCI with dynamic RSI support/resistance may offer more precise trading signals compared to using CCI alone.
Dynamic Adaptation: The RSI-based bands adapt to changing market conditions, potentially providing more relevant support and resistance levels.
Divergence Confirmation: dynamic s&r RSI adds confluence to potential trend reversals identified by the CCI.
Potential Usage:
Traders might use this indicator to:
Identify potential overbought/oversold conditions using the CCI and its relationship to the dynamic RSI bands.
Look for breakouts beyond the dynamic support/resistance levels as potential entry points.
Confirm potential trend reversals using RSI divergence (cyan and red label above divergence) signals.
Further Development Considerations:
Customizable Parameters: Allowing users to adjust the CCI length, RSI periods, and smoothing factors would enhance flexibility.
Alert Conditions: Adding alerts for breakouts, overbought/oversold conditions, and divergence signals would improve usability.
Backtesting: Thoroughly backtesting the indicator's performance across different assets and timeframes is essential before using it for live trading.
DISCLAIMER: !!
indicator is a custom technical analysis tool designed for educational and informational purposes only. It should not be construed as financial advice or a recommendation to buy or sell any security. Trading involves substantial risk of loss and may not be suitable for all investors.
Key Points to Consider:
No Guarantee of Profitability: The indicator's past performance is not indicative of future results. No trading strategy can guarantee profits or eliminate the risk of losses. You could lose some or all of your investment.
Use at Your Own Risk: Use of this indicator is solely at your own discretion and risk. You are responsible for your trading decisions. The developers and distributors of this indicator are not liable for any losses incurred as a result of using it.
Not Financial Advice: This indicator does not provide financial advice. Consult with a qualified financial advisor before making any investment decisions.
Backtesting Limitations: Backtested results, if presented, should be viewed with caution. Past performance may not reflect future results due to various factors, including changing market conditions and the limitations of backtesting methodologies.
Indicator Limitations: Technical indicators, including this one, are not perfect. They can generate false signals, and their effectiveness can vary depending on market conditions and the specific parameters used.
Parameter Optimization: Optimizing indicator parameters for past performance can lead to overfitting, which may not translate to future profitability.
No Warranty: The indicator is provided "as is" without any warranty of any kind, either express or implied, including but not limited to warranties of merchantability, fitness for a particular purpose, or non-infringement.
Changes and Updates: The developers may make changes or updates to the indicator without notice.
By using the "HTC peppermint_07 CCI w signal + s&r RSI" indicator, you acknowledge and agree to the terms of this disclaimer. If you do not agree with these terms, do not use the indicator.

RSI Overbought/Oversold [Overlay Highlighter]Indicator to show when the RSI is in oversold(Below 30) or overbought (Above 70) conditions. The background color of the chart changes colors in the areas where the above conditions are met.
Price can often reverse in these areas. However, this depends on the strength of the trend and price may continue higher or lower in the direction of the overall trend.
Divergence has been added to aid the user in timing reversals. Divergences are plotted by circles above or below the candles. Divergence is confirmed so there is a delay of one candle before the signal is given on the previous candle. Again, everything depends on the strength of the trend so use proper risk management.
Once the RSI has entered into oversold/overbought conditions, it is recommended to wait for divergence before entering into the trade near areas of support or resistance. It is recommended to utilize this strategy on the H4 timeframe, however, this particular strategy works on all timeframes.
This indicator is a modified version of seoco's RSI Overbought/Oversold + Divergence Indicator . The user interface has been refined, is now overlayed on the chart, and my own divergence code has been inserted.

ERDAL SARIDAS Visual RSIOne-stop shop for all your divergence needs, including:
(1) A single metric for divergence strength across multiple indicators.
(2) Labels that make it easy to spot where the truly strong divergence is by showing the overall divergence strength value along with the number of divergent indicators. Hovering over the label shows a breakdown of each divergent indicator and its individual divergence strength value.
(3) Fully customizable, including inputs for pivot lengths, divergence types, and weights for every component of the divergence strength calculation. This allows you to quickly and easily optimize the output for any chart. Don't worry, the default settings will have you covered if you're not interested in what's going on under the hood.
The Divergence Strength Calculation:
The total divergence strength value is the sum of the divergence strengths of all indicators for which divergence was detected at a given bar. Each indicator's individual divergence strength is comprised of two basic components: (1) |ΔPrice| - the magnitude of the change in price over the divergence period (pivot-to-pivot), and (2) |ΔIndicator| - the magnitude of the change in indicator value over the divergence period.
Because different indicators' scales and volatility can vary greatly, the Δ values are expressed in terms of standard deviation to ensure that the values are meaningful and equitable across all indicators and assets/instruments/currency pairs, etc:
|ΔIndicator| = |indicator_value_1 - indicator_value_2| / 2 * StDev(indicator_series,100)
Calculation Weights:
All components of the calculation are weighted and can be modified on the Inputs page in settings (weights are simply multipliers). For example, if you think hidden divergence should carry less weight than regular divergence, you can assign it a lesser weight. Or if you think RSI divergence is worth more than OBV divergence, you can adjust their weights accordingly. List of weights:
Regular divergence weight - default = 1
Hidden divergence weight - default = 1
ΔPrice weight - default = 0.5 (multiplied by the ΔPrice component)
ΔIndicator weight - default = 1.5 (multiplied by the ΔIndicator component)
RSI weight - default = 1.1
OBV weight - default = 0.8
MACD weight - default = 0.9
STOCH weight - default = 0.9
Development for additional indicators is ongoing, as is research into the optimal weight configuration(s).
Other Inputs:
Pivot lengths - specify the number of bars before and after each pivot high/low to consider it a valid candidate for divergence.
Lookback bars and Lookback pivots - specify the number of bars or the number of pivots to look back across.
Price sources - specify separate price sources for bullish and bearish divergence
Display settings - specify how lines and labels should display, including which divergence strength values should show the largest labels. Include/exclude specific divergence types and indicators.
Please report any bugs, or let me know if you have any enhancement suggestions or requests for additional indicators.

[fikira] Divergences (RSI)This script can be used with candlesticks, accompanied with " RSI + Divergences"
The calculation is different than my "Divergences (Pivots)"
Thank you!

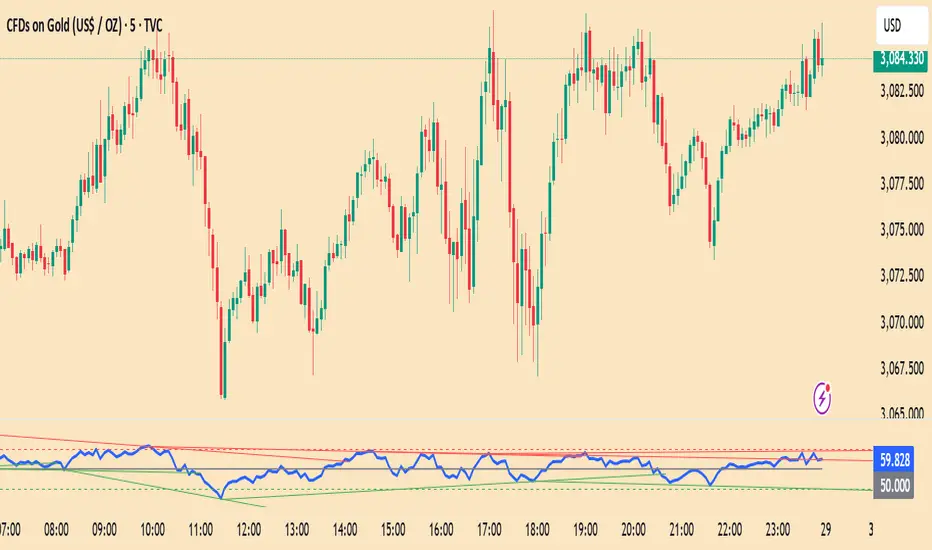
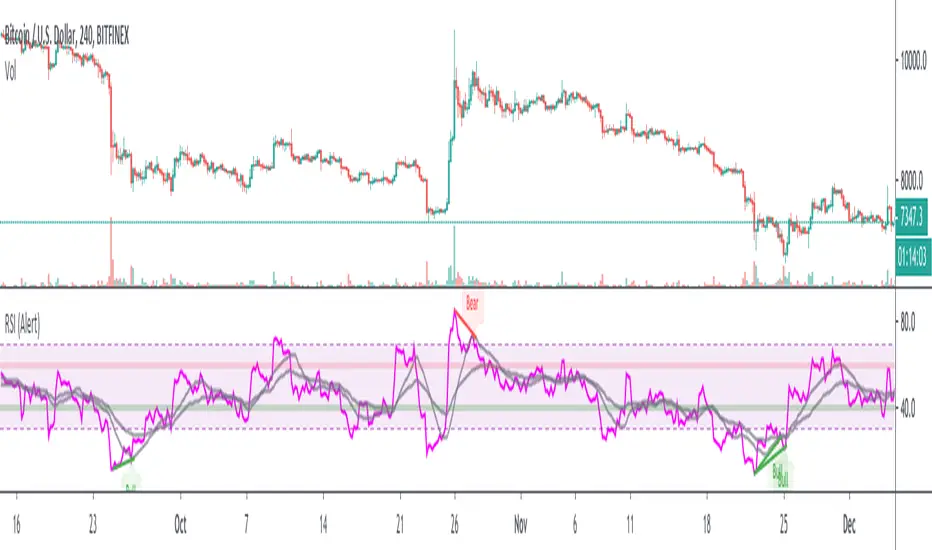
RSI w/ MAs & Divergences (Alert)This script fires off real-time RSI Divergence alerts.
To best use the RSI Divergence indicators, adjust the following settings accordingly.
• RSI Bullish Divergence Under: 20 – 45 (lower for larger volatility and more bearish markets)
• RSI Bearish Divergence Above: 55 – 80 (higher for larger volatility and more bullish markets)
Key Notes:
1. Set "Once Per Bar" instead of "Once Per Bar Close" alert.
The strategy already uses prior bar close (instead of current bar close) for calculation. This ensures that the signals will stay as they are after fired off, even when the current bar price is still changing.
2. It's OKAY to see the "alert may trigger differently than expected" warning.
Reason why you are seeing this warning is because we used a function called valuewhen() in our strategy. This function does not look at the entire history of data and has several limitations. For instance, on a 30min resolution, at the end of 2018, the function will be able to find past occurrences of BTC exceeding 16k. However, the function won't be able to find such occurrences at the end of 2019. Since our strategy is only concerned with very recent events, these limitations will not impact our results or cause repainting. You can find out more about this in the TradingView Wiki .
RSI w/ MAs & DivergencesTo best use the RSI Divergence indicators, adjust the following settings accordingly.
• RSI Bullish Divergence Under: 20 – 45 (lower for larger volatility and more bearish markets)
• RSI Bearish Divergence Above: 55 – 80 (higher for larger volatility and more bullish markets)
THIS SCRIPT DOES NOT REPAINT AND IS COMPLETELY FREE.

Bull Bear Divergence IndicatorFor Constance Brown-like analysis with divergence signals between price and indicator (i.e. stock close / RSI divergence)
Using two different lines: an indicator high line for bearish, and an indi low line for bullish divergences
For your individual studies, choose your indicator and replace rsi in line 10 with it, any thing else is auto. Script bottom: optional comparison linse addable
Note1: The script only shows divergences to recent pivots, not between actual pivot and one "a few pivots ago"
Note2: Though reversal predictions with the example of SPLK here are quite good, in general better results are obtained with un-normalized indicators.

Crazy Scalping StrategyThe RSI divergence has very significant meaning in the market, it means, the trend is turning. It can even predict the reversal. Just like the acceleration to the car, if you try to reverse your speeding up car, the first thing changed before the reversal happen is the acceleration direction changed, first decrease then, it turn to the negative value. The RSI divergence is similar to that negative value, it's indicating the trend is changing. The trend will normally reverse after the RSI divergence occurs, but this is not all the story of RSI divergence.
RSI divergence 是一个非常重要的指标。 他所展现的是这个市场的趋势在变化。他甚至可以预测趋势的反转。就像加速度对于加速中的汽车,如果你想后退,第一个被改变的就是加速度了,当汽车行进方向还没改变之前,你的加速度就已经开始变成一个负数,而RSI divergence 如同那个负数,预示着趋势即将反转,但这并不是RSI divergence的一切。
It can help you be the most genius trader in the world cause it indicate the trend is changing, and you happen to catch the reversal point and make a sniper shot into the head. It can also make you be the most stupid trader in the world when it shows up in an ABC correction and after that the trend is keep going. So, when using this indicator, you have to know what kind of reward you might gain from it and what kind of risk you are taking. Luckily, we can actually reduce most of the "stupid" trades by relying on the basic TA, let me explain it below the comment.
他也许可以帮你成为世界上最聪明的交易者,因为他提前揭示了趋势在变化,然后你刚好抓住了那个反转点,进行了一笔精准的交易。但是他也可能让你变成世界上最差的交易者,如果他恰巧出现在一个小的回调中,而你座对了小回调,错过了大方向。但是我接下来能够在评论里面利用基本的分析策略配合该脚本消除掉那些愚蠢的交易,这里面涉及到权重的分配问题。

Yelober - Intraday ETF Dashboard# How to Read the Yelober Intraday ETF Dashboard
The Intraday ETF Dashboard provides a powerful at-a-glance view of sector performance and trading opportunities. Here's how to interpret and use the information:
## Basic Dashboard Reading
### Color-Coding System
- **Green values**: Positive performance or bullish signals
- **Red values**: Negative performance or bearish signals
- **Symbol colors**: Green = buy signal, Red = sell signal, Gray = neutral
### Example 1: Identifying Strong Sectors
If you see XLF (Financials) with:
- Day % showing +2.65% (green background)
- Symbol in green color
- RSI of 58 (not overbought)
**Interpretation**: Financial sector is showing strength and momentum without being overextended. Consider long positions in top financial stocks like JPM or BAC.
### Example 2: Spotting Weakness
If you see XLK (Technology) with:
- Day % showing -1.20% (red background)
- Week % showing -3.50% (red background)
- Symbol in red color
- RSI of 35 (approaching oversold)
**Interpretation**: Technology sector is showing weakness across multiple timeframes. Consider avoiding tech stocks or taking short positions in names like MSFT or AAPL, but be cautious as the low RSI suggests a bounce may be coming.
## Advanced Interpretations
### Example 3: Sector Rotation Detection
If you observe:
- XLE (Energy) showing +2.10% while XLK (Technology) showing -1.50%
- Both sectors' Week % values showing the opposite trend
**Interpretation**: This suggests money is rotating out of technology into energy stocks. This rotation pattern is actionable - consider reducing tech exposure and increasing energy positions (look at XOM, CVX in the Top Stocks column).
### Example 4: RSI Divergences
If you see XLU (Utilities) with:
- Day % showing +0.50% (small positive)
- RSI showing 72 (overbought, red background)
**Interpretation**: Despite positive performance, the high RSI suggests the sector is overextended. This divergence between price and indicator suggests caution - the rally in utilities may be running out of steam.
### Example 5: Relative Strength in Weak Markets
If SPY shows -1.20% but XLP (Consumer Staples) shows +0.30%:
**Interpretation**: Consumer staples are showing defensive strength during market weakness. This is typical risk-off behavior. Consider defensive positions in stocks like PG, KO, or PEP for protection.
## Practical Application Scenarios
### Day Trading Setup
1. **Morning Market Assessment**:
- Check which sectors are green pre-market
- Focus on sectors with Day % > 1% and RSI between 40-70
- Identify 2-3 stocks from the Top Stocks column of the strongest sector
2. **Midday Reversal Hunting**:
- Look for sectors with symbol color changing from red to green
- Confirm with RSI moving away from extremes
- Trade stocks from that sector showing similar pattern changes
### Swing Trading Application
1. **Trend Following**:
- Identify sectors with positive Day % and Week %
- Look for RSI values in uptrend but not overbought (45-65)
- Enter positions in top stocks from these sectors, using daily charts for confirmation
2. **Contrarian Setups**:
- Find sectors with deeply negative Day % but RSI < 30
- Look for divergence (price making new lows but RSI rising)
- Consider counter-trend positions in the stronger stocks within these oversold sectors
## Reading Special Conditions
### Example 6: Risk-Off Environment
If you observe:
- XLP (Consumer Staples) and XLU (Utilities) both green
- XLK (Technology) and XLY (Consumer Disc) both red
- SPY slightly negative
**Interpretation**: Classic risk-off rotation. Investors are moving to safety. Consider defensive positioning and reducing exposure to growth sectors.
### Example 7: Market Breadth Analysis
Count the number of sectors in green vs. red:
- If 7+ sectors are green: Strong bullish breadth, consider aggressive long positioning
- If 7+ sectors are red: Weak market breadth, consider defensive positioning or shorts
- If evenly split: Market is indecisive, focus on specific sector strength instead of broad market exposure
Remember that this dashboard is most effective when combined with broader market analysis and appropriate risk management strategies.

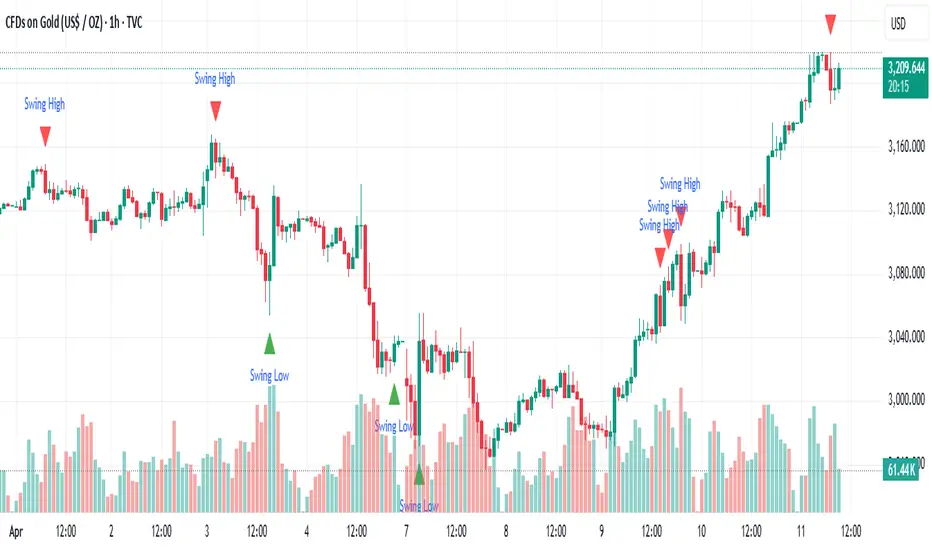
Rendon1 Swing Market Turns**Swing Market Turns Indicator**
This indicator identifies potential swing highs and swing lows by integrating Relative Strength Index (RSI), volume confirmation, and higher timeframe (HTF) levels to accurately detect market reversals and turning points. Specifically optimized for swing traders, this tool aims to pinpoint moments when price momentum is shifting, providing clear signals for trade entries and exits.
### How It Works:
- **RSI Divergence:** Detects momentum shifts through RSI overbought and oversold conditions.
- **Higher Timeframe Levels:** Confirms reversals using support and resistance levels from higher timeframes.
- **Volume Confirmation:** Ensures stronger validity of signals by checking if current volume exceeds the moving average of recent volume.
### Key Features:
- Visual labels on chart clearly indicating potential swing highs and lows.
- Customizable RSI period, RSI overbought/oversold thresholds, volume moving average length, and higher timeframe selections.
- Built-in alert conditions for immediate notifications when swing opportunities are detected.
### Recommended Use:
- Ideal for traders focusing on swing trading strategies, particularly those looking for high-probability turning points.
- Effective across multiple assets including forex, stocks, commodities, and crypto.
- Suitable for various intraday and higher timeframes, with customization options available.
### Settings:
- **RSI Period:** Adjust the sensitivity of RSI calculation.
- **Higher Timeframe:** Select the timeframe used for support/resistance reference.
- **RSI Overbought/Oversold:** Customize thresholds defining extreme RSI values.
- **Volume MA Length:** Specify the length for volume moving average calculation.
Feel free to customize the parameters to best fit your trading style and asset of choice.
**Disclaimer:**
This indicator does not guarantee profitable trades and should be used in conjunction with proper risk management and additional analysis methods.
Super RSI: Multi-Timeframe, Multi-RSI-MA, Multi Symbol [DucTri]█ Overview
RSI is a very popular indicator that almost every trader knows about. I created this indicator with the goal of helping you use RSI more conveniently and effectively.
█ Uses
Monitor the RSI of 10 currency pairs simultaneously.
The first column shows the RSI of the current currency pair.
RSI below 30 will have a Red background, and above 70 will have a Green background.
Display multiple RSI lines with different lengths (or timeframes).
Displays 3 RSI with 3 different lengths 7, 14 and 21
Displays two RSI lines with two different timeframes. The purple line shows RSI (14) for the 1H timeframe, and the blue line shows RSI (14) for the 4H timeframe.
Display MA and Bollinger Band lines for RSI.
Shows the RSI line along with two MA lines of the RSI: EMA (9) in blue and WMA (45) in red.
Identify RSI Divergence with custom settings
█ Input
- You can have up to three RSI lines, with customizable lengths and timeframes.
- You also have up to three RSI-MA lines, where you can customize the MA type and length.
- You can track RSI for up to 10 currency pairs at the same time.
- Additionally, you can change how the top (or bottom) is determined when identifying divergence.
█ Alerts
Send alerts when two RSI lines cross. For example, when the RSI 14 crosses above the RSI 21, or the RSI on the 1H timeframe crosses above the RSI on the 4H timeframe.*
Send alerts when RSI crosses above or below the RSI-MA line.
Send alerts when two RSI-MA lines cross. For example, when the RSI-EMA (9) crosses above the RSI-WMA (45).*
Send alerts when Divergence (Convergence) appears.
Send alerts when any currency pair in the monitored list shows an Overbought or Oversold signal.

RSI Trending with DivergencesThis script uses the RSI and RSI divergences to mark signals where the rsi is both below/above the 50, below/above its moving average, and where the last regular or hidden divergence matches that state. The RSI is built into the indicator, so you don't need it in your bottom pane if you don't want it, I just put one there for illustrative purposes. Please note it will not print the same signal consecutively, as it is meant to show an overall direction, not the in and out fluctuations. I suggest using it in conjunction with some moving averages so you can ignore signals not in the trend.
Jurik Smoothed Stochastic - TraderHalaiJurik Smoothed Stochastic
The stochastic indicator has been long used by traders to identify inflection points in the price and to give a direction on Bullish and Bearish bias.
This indicator aims to improve on the plots the %K value smoothed using a Jurik Filter instead of a simple moving average. This allows for a more adaptive K value average price, whilst also providing superior smoothing to traditional moving averages.
As the Jurik Filter is a proprietary and non-open-source implementation, this script uses a common filters library implementation of Jurik MA which is a suitable proxy to the actual Jurik MA filter.
Big thanks to LastGuru for making his version freely available. You can find his version of the Jurik Filters in the credits section below.
%K is the Jurik Smoothed Version of the original Stochastic Formula
%D is calculated using the following formula. This idea was borrowed from John Ehler’s stochastic implementation and can be seen below:
%D = 0.05 + 0.95 * K
Features
%K line, Overbought and Oversold level and Mid Line Level
Oversold / Overbought reversal indicators and signals - Shown in Red and Green
Bullish / Bearish Divergences – Including Hidden divergences to spot reversals and continuations of trend (Big thanks to the developers of the built-in RSI Divergence indicator) - Shown as below:
Bullish / Bearish crossover of %K with %D - Shown in Cyan and Fuschia
Alerts for all of the above conditions
Double Jurik smoothing mode - similar to slow Stochastic
Credits :
Massive shoutout to the following scripts:
LastGuru JurikMA implementation (Common Filters Library)
Divergence Indicator – Built into TradingView and coded by TradingView Developers
This script is published as open source to allow for criticism, further development of this strategy and use by the community. Feel free to use this indicator/source code as you see fit.
Enjoy! :)

RSI Div at Daily VWAP StDevMean Reversion indicator based on RSI Divergences at Overbought/Oversold conditions with Price above/below a Standard Deviation from Daily VWAP. Useful for intra-day trading.
Signal criteria:
1. RSI is at Overbought/Oversold
2. RSI Divergence present (not hidden)
3. RSI has not reached Neutral level (i.e. 50)
4. Price has crossed above/below a Standard Deviation from Daily VWAP
Config Options:
- RSI length (default:14)
- Divergence Lookback Period (default:14)
- RSI Oversold/Overbought tresholds (default: 70/30)
- RSI Reset Level (default: 55/45)
- Use VWAP Std Dev (default: yes)
- Standard Deviation from Daily VWAP (default: 1.51)
Use with discretion.

Cuban's LTF Trend OscillatorMost financial markets tend to trade within a reasonable range between 60-75% of the time (don't ask for a reference because I couldn't find it), so swing trading with a trend isn't always viable -- so how do we take money out of the market?
If you're familiar with scalping low time frames for 20 or 30 ticks, you'll know how difficult it is to time your entry and exit during low volatility environments.
The following oscillator has been solely built to assist the manual discretionary trader in their LTF scalps.
The oscillator uses a combination of different price to VWAP relationship, divergence, and momentum logic to define preferable entries.
This script attempts to identify three different entries characteristics on low timeframes:
1. Counter-trend reversals
2. On-trend pullbacks
3. and, short term directional pivots
The oscillator has red, green, and white triangles above the centre fill. These triangles relate to the low time frame RSI divergence and pivots.
In combination with these divergences and pivots, I've added a measure of conviction, identified by the light red, dark red, light green, and dark green rectangles on the outer-most edges of the oscillator.
The dark red and dark green flavours are the highest conviction trades. When you marry these sentiment identifiers with divergences, you have a very high conviction trade.
The fill in the middle of the oscillator is the current trend sentiment. Dark red and dark green is favourable to the respective trend, with the light red and light green being areas where I recommend taking profit or considering an exit.
The green and red coloured moving average in the centre is the slower trend. I have included this to give some context to preferable position adds and closes. Trading with the trend is always advisable. When you have an obvious trend, this oscillator can give you excellent entries to play that continuation.
Warm regards,
Cubantobacco

Gambit Trading Suite v3.0Gambit Trading Suite v3.0
New features:
* Better trading algorithms
* Every feature and candle color can now be fully customized
* Better RSI Divergence logic
* Built in trading alerts
* Cleaner code
& more!
The Gambit Trading Suite was designed to combine all of the best signals into one single indicator. This suite should tell you everything you need to know about price.
Try this indicator for FREE! Leave a comment below and we will give you access to the trading suite generally within 72 hours.
Quick Setup (after you have been granted access):
1. Navigate to any chart and right click on the background. Click on "Insert Indicator."
2. Click on "Invite-Only Scripts" and you will see the Gambit Trading Suite as an option. Click it to add it to your chart.
3. By default, the majority of the indicators are disabled. Click the gear icon to the right of the indicator name at the top left of your chart. It should be the second button after "Gambit Trading Suite v3.0."
4. After opening the config menu, you can enable whichever indicators you want.
(For the complete step-by-step setup guide & full indicator documentation, please send me a message)
Confirmed Reversals
These offer the best locations to buy/long with the least risk. The majority of the time they turn out to be the reversals from bearish price action. If the trade does not turn profitable immediately, the algorithm is designed to fail as soon as possible so you can close at breakeven or a very small loss. The profitable trades can be left to run. Over time and when stacked with other indicators, these entries can increase the profitability of your trades and reduce your losing ones. Confirmed Reversals on the chart show up as the letter C with an arrow upwards. They are blue in the example above.
Colored Candles
Helps you to see the strength of the trend in real-time, and helps you to make smarter trade entries and exits.
Bullish Breakout = Blue
Bullish Unconfirmed Reversal = Yellow
Bullish Trend (Weak) = Pistachio Green
Bullish Trend (Strong) = Lime Green
Bearish Breakdown = Dark Purple
Bearish Pivot (1 to 3 candles bearish bias) = Orange, shown with a downward arrow and the letter B on the chart. The signal fails if a future candle closes above the orange one.
Bearish Trend = Red
Stalled After Price Breakout = Olive Green
Neutral Pivot , Minor Bullish Bias = Bright Purple
Neutral / No Trend = Gray
Gambit Daily & Weekly Levels
These provide dynamically-updated daily and weekly support and resistance levels. It is very common to see price retest these levels, so it offers a decent place to set alarms or bids.
RSI Divergences
The Gambit Trading Suite posts green flags for bullish RSI divs, and red flags for bearish RSI divs. Both hidden and regular divergences are marked.
Gambit StochRSI Grid (This indicator is listed separately. Please visit my profile page to get it)
This indicator highlights StochRSI overbought/oversold values for 1D, 2H, 1H, & 30m timeframes (From top to bottom. Timeframes can be changed in settings).
If the lower three timeframes are all overbought/oversold, a direction arrow will show, suggesting the direction of the trend. By default, there are four available timeframes tracked, three of which are low timeframe and one is for a quick-glance at the 1D. Only the lower three are utilized for printing arrow signals.
Public indicators:
For your convenience, we have bundled the most commonly requested indicators inside the suite. They include:
Ichimoku Cloud (Optimized for the cryptocurrency markets by default but it can be optimized to any settings)
EMA #1 (Shown as purple and pink crosses in the example above)
EMA #2 (Shown as pink crosses)
Bollinger Bands
Pivot Points
For a detailed step-by-step setup guide & full documentation on the indicators, feel free to message me.

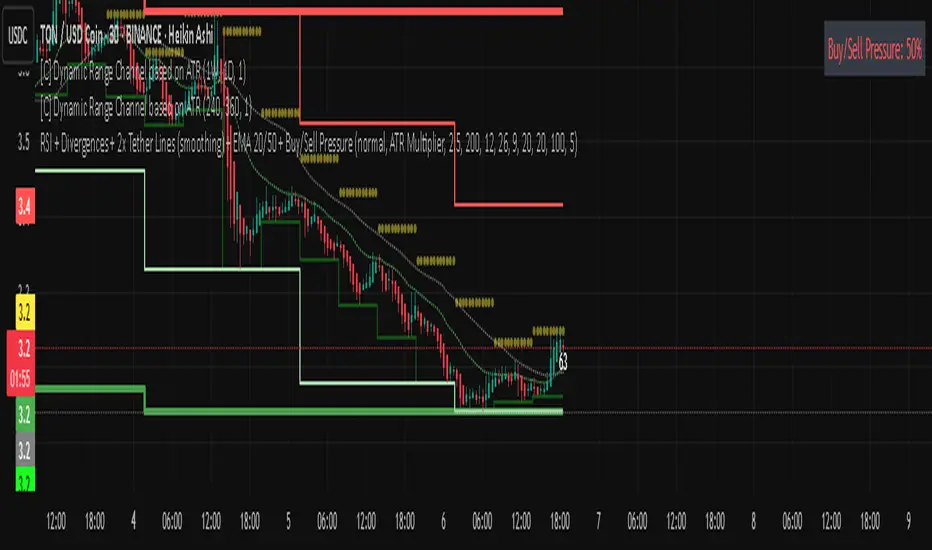
Rsi bar, divergences, tether line, ema 20,50 -Ema 20,50
-Tether Line dominance
-Buy/sell pressure
-Rsi last candle
-byu sell signal
-rsi divergence
-macd divergence
-Coloured candles 25,30 rsi and 70 rsi
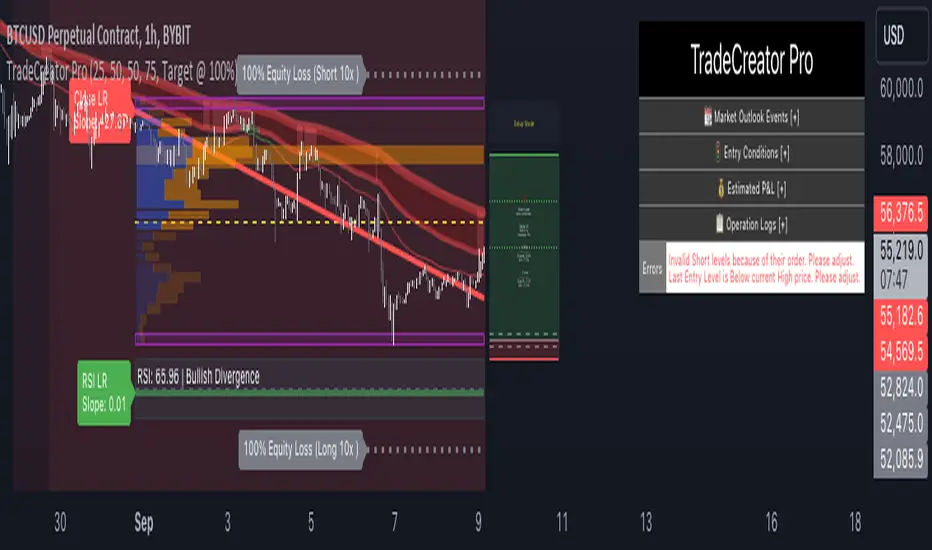
TradeCreator Pro - Moving Averages, RSI, Volume, Trends, Levels█ Overview
TradeCreator Pro is designed to help you build successful trades by streamlining the processes of trade planning, evaluation, and execution. With a focus on data accuracy, speed, precision, and ease of use, this all-in-one tool assists in identifying optimal entry and exit points, calculating risk/reward ratios, and executing trades efficiently. Whether you’re a beginner or an experienced trader, TradeCreator Pro empowers you to make informed, data-driven decisions with real-time signals and fully customizable settings.
█ Key Benefits & Use Cases
TradeCreator Pro is designed to help you effortlessly discover profitable trades by evaluating and testing multiple setups across different assets and timeframes. Key use cases include:
Quick Strategy Testing: Rapidly test multiple setups and strategies, gaining immediate insights into their potential outcomes.
Risk/Reward Evaluation: Quickly identify which trade ideas are worth pursuing based on their profitability and associated risk.
Multi-Timeframe Testing: Seamlessly test the same trading setup across various timeframes and tickers.
Backtesting: Analyze the historical performance of specific setups to gauge their effectiveness.
Key Level Identification: Instantly spot critical support and resistance levels, improving your decision-making process.
Custom Alerts: Set personalized notifications for key levels, ensuring timely action on potential trade opportunities.
█ Core Features
Dashboard: A real-time view of critical metrics such as trend strength, support/resistance levels, volume profiles, RSI divergence, and trade scoring. Designed to provide a comprehensive snapshot of your trading environment and potential trading outcome.
Trend Analysis: Detect prevailing trends by analyzing multiple moving averages, support/resistance zones, volume profile and linear regressions for RSI and closing prices.
Support & Resistance Identification: Automatically identify support and resistance levels.
Volume Profile: Visualize volume profile and its point of control across support/resistance ranges, helping you spot key consolidation areas.
RSI & Price Divergence Detection: Identify potential divergences between RSI and price through linear regressions, providing valuable trade signals.
Risk Management Tools: Set equity loss levels based on specified leverage, allowing you to manage risk effectively for both long and short trades.
Entry & Exit Recommendations: Identify multiple options for optimal entry and exit levels based on current market conditions.
Trade Scoring: Score each trade setup on a 0-100 scale, factoring in potential ROI, ROE, P&L, and Risk-Reward Ratios to ensure high-quality trade execution.
Dynamic Execution & Monitoring: Benefit from multi-stage exit strategies, dynamic trailing stop losses, and the ability to backtest setups with historical data.
Alerts & Automation: Customize alerts for key market movements and opt for manual or automated trading through TradingView’s supported partners.
█ How to Use
Installation: Add TradeCreator Pro to your TradingView chart.
Trend Adjustment: The system automatically detects the current market trend, but you can fine-tune all trend detection parameters as needed.
Trading Parameter Configuration: Customize entry, exit, profitability, and risk-reward settings to match your trading style.
Entry and Exit Level Refinement: Use the automated suggestions, or choose from conceptual or arbitrary levels for greater control.
Stop Loss and Profit Target Fine-Tuning: Apply the system’s recommendations or adjust them by selecting from multiple available options.
Backtest Setup: Run the backtester to analyze past performance and assess how the strategy would have performed historically.
Set Alerts: Stay informed by setting alerts to notify you when a trade setup is triggered.
█ Notes
The first time you apply the indicator to a chart, it may take a few moments to compile. If it takes too long, switch timeframes temporarily to restart the process.
█ Risk Disclaimer
Trading in financial markets involves significant risk and is not suitable for all investors. The use of TradeCreator Pro, as well as any other tools provided by AlgoTrader Pro, is purely for informational and educational purposes. These tools are not intended to provide financial advice, and past performance is not indicative of future results. It is essential to do your own research, practice proper risk management, and consult with a licensed financial advisor before making any trading decisions. AlgoTrader Pro is not responsible for any financial losses you may incur through the use of these tools.
No-Lag MA Crossover ScalperThe No Lag Crossover Scalper aims to capitalize on short-term trends using a combination of Hull Moving Average (HMA) for trend detection and multiple indicators for generating buy and sell signals. Here’s an overview of its components and approach:
1. Trend Detection with Hull Moving Averages (HMA) :
- Dual Hull MA Setup : Uses two Hull Moving Averages (HMA) to detect crossovers and crossunders, which are signals of short-term trend changes.
- No Lag Nature : HMAs are chosen for their ability to reduce lag compared to traditional moving averages, providing quicker responses to price movements.
2. Indicators for Signal Generation :
- Relative Strength Index (RSI) : Detects overbought and oversold conditions, generating signals when price movements diverge from RSI readings.
- Moving Average Convergence Divergence (MACD) : Provides signals based on the convergence and divergence of two moving averages, indicating potential trend reversals.
- Stochastic Oscillator (Stoch) : Identifies momentum shifts by comparing the current closing price to its range over a specific period.
- On-Balance Volume (OBV) : Measures buying and selling pressure based on volume flow, signaling potential changes in price direction.
- RSI Divergence : Looks for discrepancies between price action and RSI values, suggesting weakening trends and possible reversals.
3. Signal Generation Logic :
- Buy Signals : Generated when both HMAs cross over, supported by bullish indications from RSI, MACD, Stoch, OBV, or RSI divergence. At least 2 indicators must be true to generate a signal.
- Sell Signals : Triggered when HMAs cross under, complemented by bearish signals from the mentioned indicators.
4. Implementation and Optimization :
- Parameter Optimization : Fine-tuning of indicator periods and sensitivity settings to balance signal accuracy and responsiveness.
- Confirmation Mechanisms : Use of multiple indicators to confirm signals, reducing false positives and enhancing reliability.
Overall, the No Lag Crossover Scalper combines the speed of Hull Moving Averages with the reliability of multiple indicators to identify short-term trends effectively. By focusing on no lag indicators and confirming signals with diverse technical tools, it aims to capitalize on rapid market movements while managing risk through disciplined execution.
Credits: used TradingView ta library for a lot of the built-in indicators.
Disclaimer: This is still experimental beta version so use at your own risk.

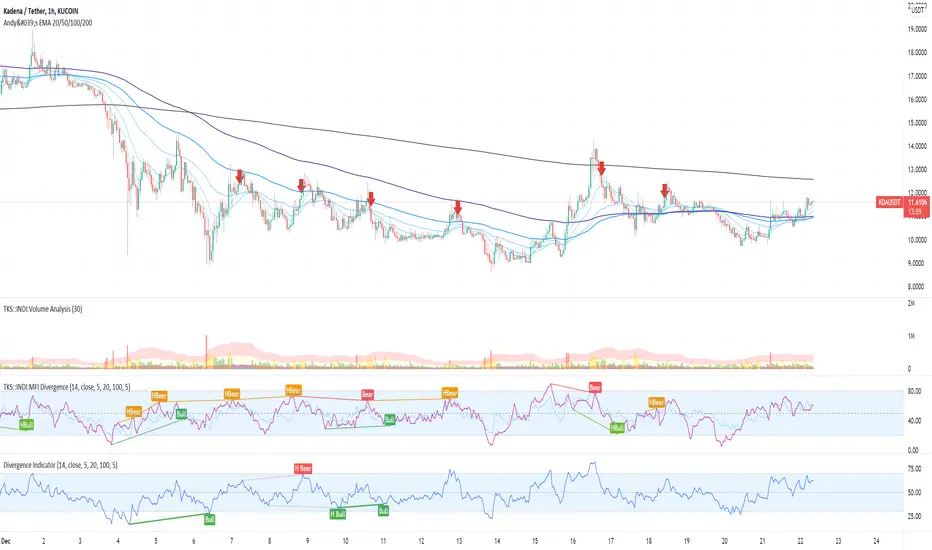
MFI Divergence Indicator Our Developer Malin converted the built-in RSI divergence indicator to MFI (Money Flow Index).
How to apply?
Notice 1: MFI, unlike the RSI, incorporates volume. It thus is an indicator of a higher precision when it comes to finding the the moment to sell - or - the moment to enter.
Notice 2: In Ranging Markets MFI (and RSI) is a solid momentum indicator to buy or sell. The asset displayed shows a slight markdown. Thus, we are looking primarily for short positions. Once can tell by us omitting the first 2 hidden bearish divergence signals and then entering the market.
Notice 3: Divergences depend on pivot points. The drawback with pivot points is that it is a lagging indication of a potential reversal. The more time (bars) one takes to confirm a reversal the less profitable is the trade - but less risky. In the charts one can tell that we enter the market 5 bars later. Usually that is not the tip of the reversal.
Notice 4: One must adapt the left and right periods of the indicator to risk/reward ratio, length of swing / frequency modulation and volatility of the price action.
Credits: Credits go to the Tradingview Team for delivering the original code. And Malin for the conversion. Please keep the copy right as a courtesy.
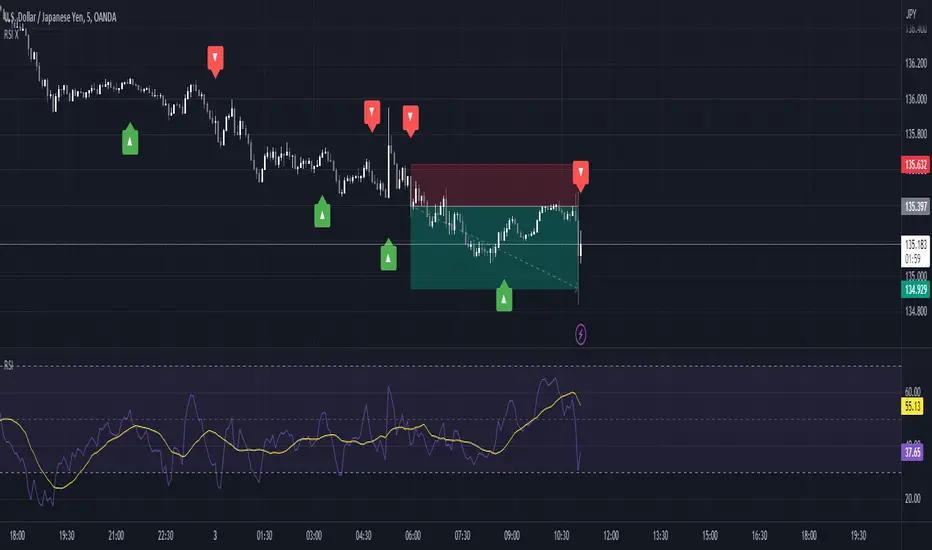
Divergence shortterm swing daytrading I've added a few lines to Mawreez' RSI Divergence Detector.
I edited the visual and filtered the signals in same direction of the current candle.
this indicator shows long and short signals based on divergences. It's better not to trade against powerful trend.

OBV with DivergenceAll I did was combine the logic from LazyBear for his OBV Oscillator to regular RSI divergence logic (where I replaced the RSI input to use LazyBear's OBV).
I didn't use any original code! Neither OBV (written by LazyBear) nor DIvergence (author unknown) was written by me. I merely modified the sytax a little to combine them.
Very useful for spotting divergences with OBV oscillator.
